

Now that my web site has been live for a couple of months I have had time to go back and see some improvements I can make. The first thing I noticed was regarding the Highchart graphs, I noticed that you could filter out the lines of the graph that you where not interested in by clicking on the related legend. So I updated the graph so that clicking on it does not move you to a new page which meant this useful dynamic legend filter functionality could be used. You can still move pages by clicking on the left hand side grid boxes
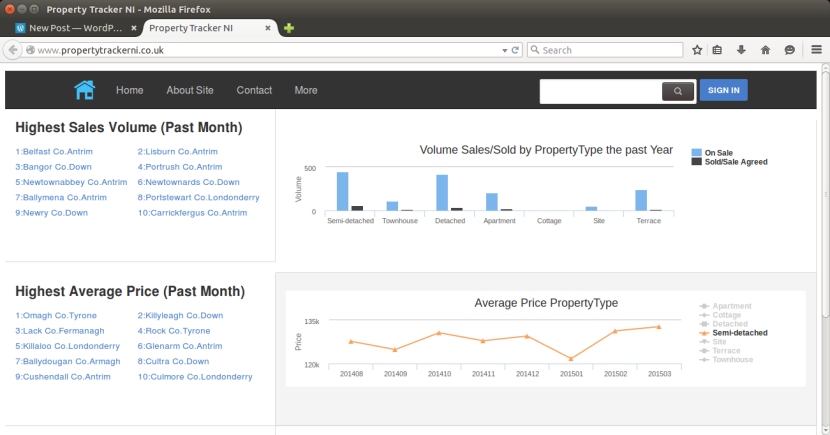
The second thing I noticed was that smaller towns ended up with the highest price. This was due to the low volumes of sales in the area. This meant a single site valued at 600,000 pounds would give high average price as it was the only one available. I do need some sorted of weighted average. Any suggestions would be welcome.
Check out http://www.propertytrackerni.co.uk