As someone who works pretty constantly on relational database development I have come across limitations on what it can do in terms of reporting and analysis. There are a lot of tools out there and when you are working in Oracle you are pretty much pushed to something large, expensive and pretty much tied to Oracle.
Elastic Search seems to cover a lot of areas not covered by relational databases with build in analysis , reporting and storage options. It seemed pretty interesting especially as it seemed to do a lot of things that would require custom development or the purchase of new tools
There are a lot of articles out there on ElasticSearch which helped along but there did not seem to be anything which described what Elastic Search is to someone coming from a database background.
So as well as reading up I set up ElasticSearch on an Ubuntu server I have which I use for this kind of thing. ElasticSearch is Open Source but it isn’t part of your standard repostory so sudo apt-get elasticsearch is not going to work. You will have to use curl commands and add repository references to your server. I will not recover all those standard article but I will mention the first gotcha none of these articles actually cover. This maybe the installation has changed over the years on Linux with even the path where elasticsearch being installed is different. The first thing you will notice that it is in a different path. To find it enter “whereis elasticsearch”. The machine I installed it on was not my local machine so I needed to access it remotely. To do this edit the file elasticsearch.yml, you need to uncomment the field network.host or add it . I set it to 0.0.0.0 which means any ip address can log on, not secure but this is on my local network and it is not running all the time. Now once you edit the elasticsearch.yml it seems to switch from development to production mode as it will not be running on a local machine so if you run it doing sudo service elasticsearch you get errors along the lines of discovery nodes being set. There are some misleading articles out there that tell you to set up everything for production in the elasticsearch.yml file but you do not need to do this. Just set discovery.seed.hosts to a blank array and it will start
 input {
  jdbc {
    jdbc_driver_library => ""
    jdbc_driver_class => "org.postgresql.Driver"
    jdbc_connection_string => "jdbc:postgresql://localhost:5432/f1"
    jdbc_user => "postgres"
    jdbc_password => "<password>"
    statement => "SELECT c.yearno race_yearno, c.roundno race_roundno,
    c.name race_name, c.dateval race_date, c.timeval race_time,
    c.url raceurl, b.constructorRef, b.name constructors_name,
    b.nationality constructor_nationality,
    b.url constructor_url, a.points constructor_points,
    a.status constructor_status, d.lat, d.lng
    FROM constructor_results a, constructors b, circuits d, races c
    WHERE a.constructorId = b.constructorId AND
      a.raceId = c.raceId AND
      c.circuitId = d.circuitId"
    type => "constructor_result"
 }
}

filter {
   mutate {
    add_field => {"[location][lon]" => "%{lng}"}
    add_field => {"[location][lat]" => "%{lat}"}
    }
}

output {
  elasticsearch
   {
        hosts => "http://localhost:9200"
        index => "%{type}"
   }
stdout {}
}
You may notice something above that does not make sense and that is the filter/mutate section I suspect. This is required if you want to model field as geo points. You don’t just require the above you also require something called templates and the easy way to do this is to use another tool called Kibana. This will need installed separately as well which I will not cover here
Once again you will need to edit another yaml file kibana.yml and set server.host to 0.0.0.0 so you can run it. There is one thing left to do sudo service kibana start. I would not have any of these services running on startup unless it was a production machine as they use a lot of memory. One gotcha also is to make sure you have a decent amount of free disk space as elasticsearch will error as it checks for adequate disk space on bootup but gives some rather obscure error messages in the log.
So now we need to import our data
So run the logstash command
sudo /usr/share/logstash/bin/logstash -f ~/f1/constructor_results.conf
Go into kibana from the browser.
It seems to run off port 5601 by default. It should look happy and healthy
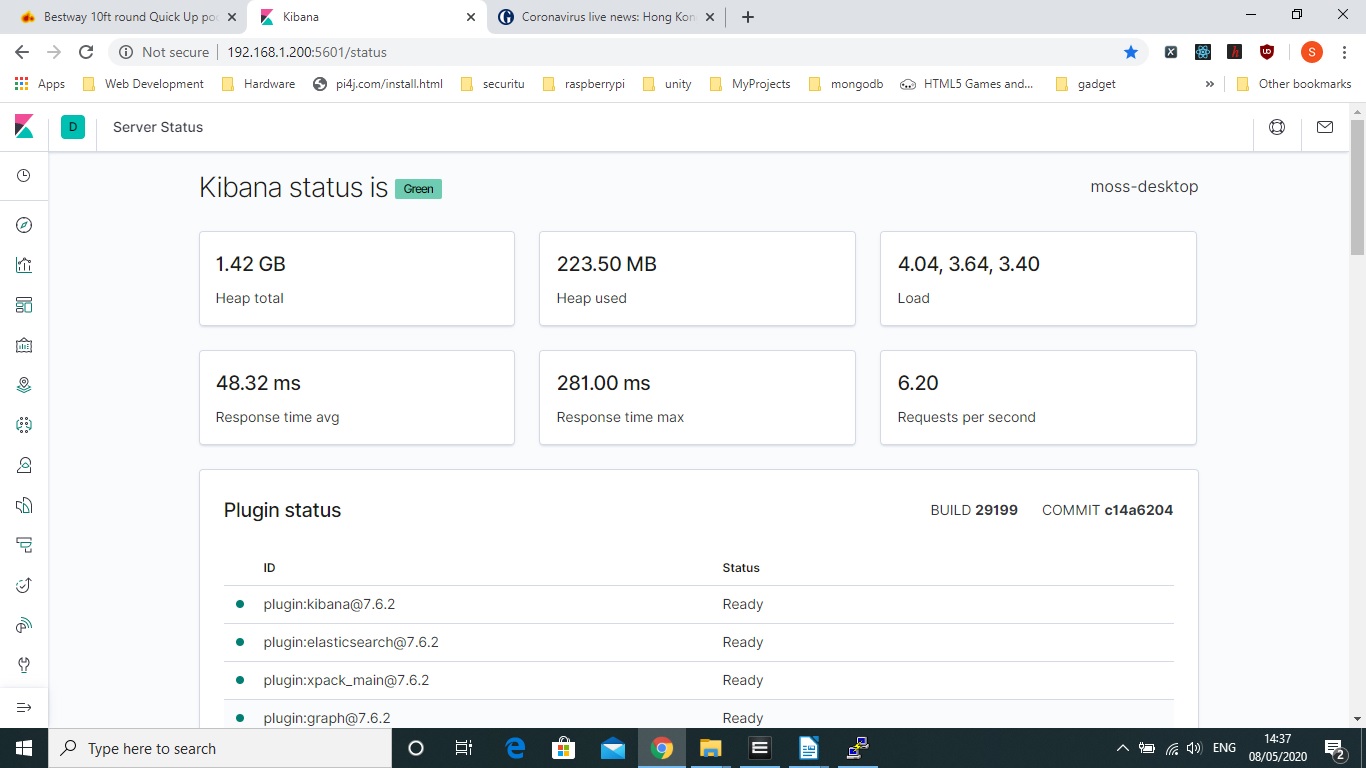
Go to Index Management as Index strangely seems to be data in ElasticSearch by clicking on the big Kibana logo.
Create an Index Pattern
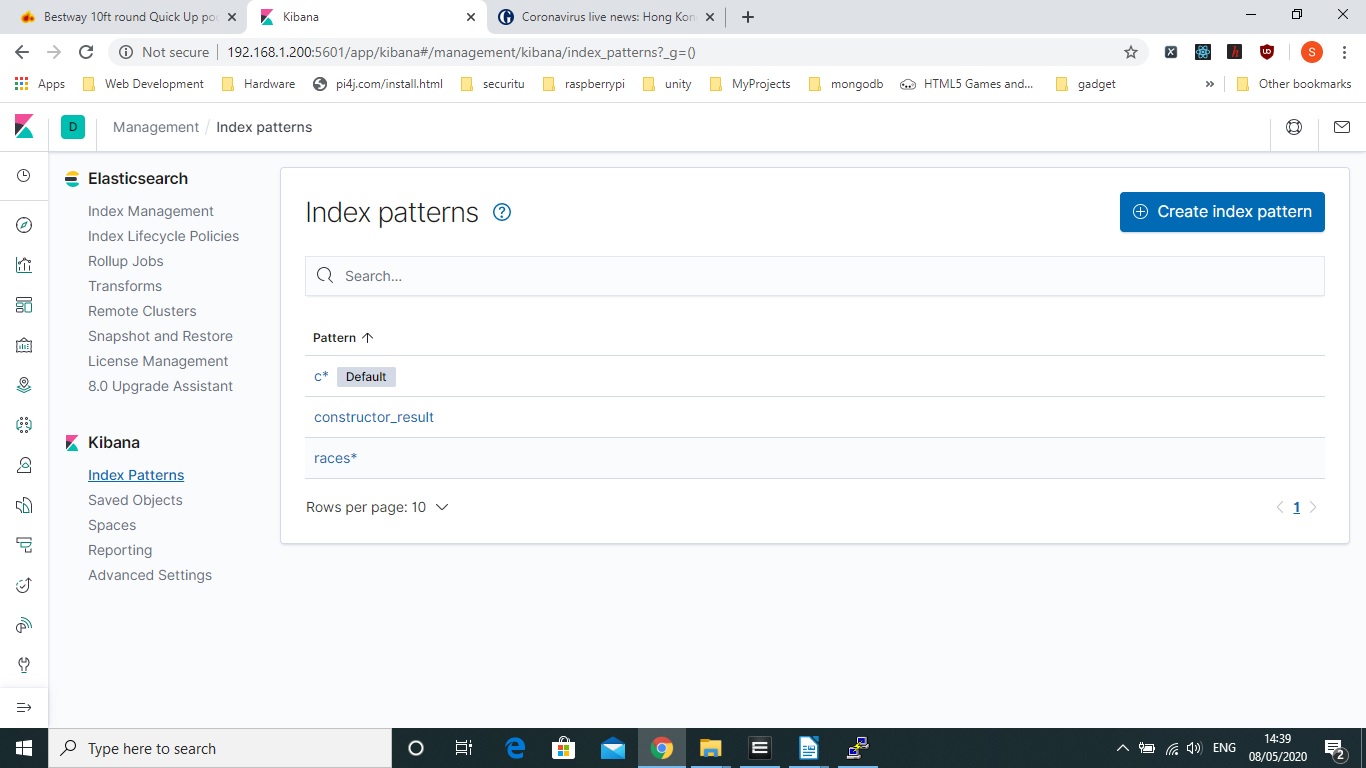
A template is basically needed if you want to format a field in a specific way for elasticsearch to model it, there are no gotchas here. You can use command lines for a lot of this but apart from logstash commands on the command line I would choose the Kibana approach.
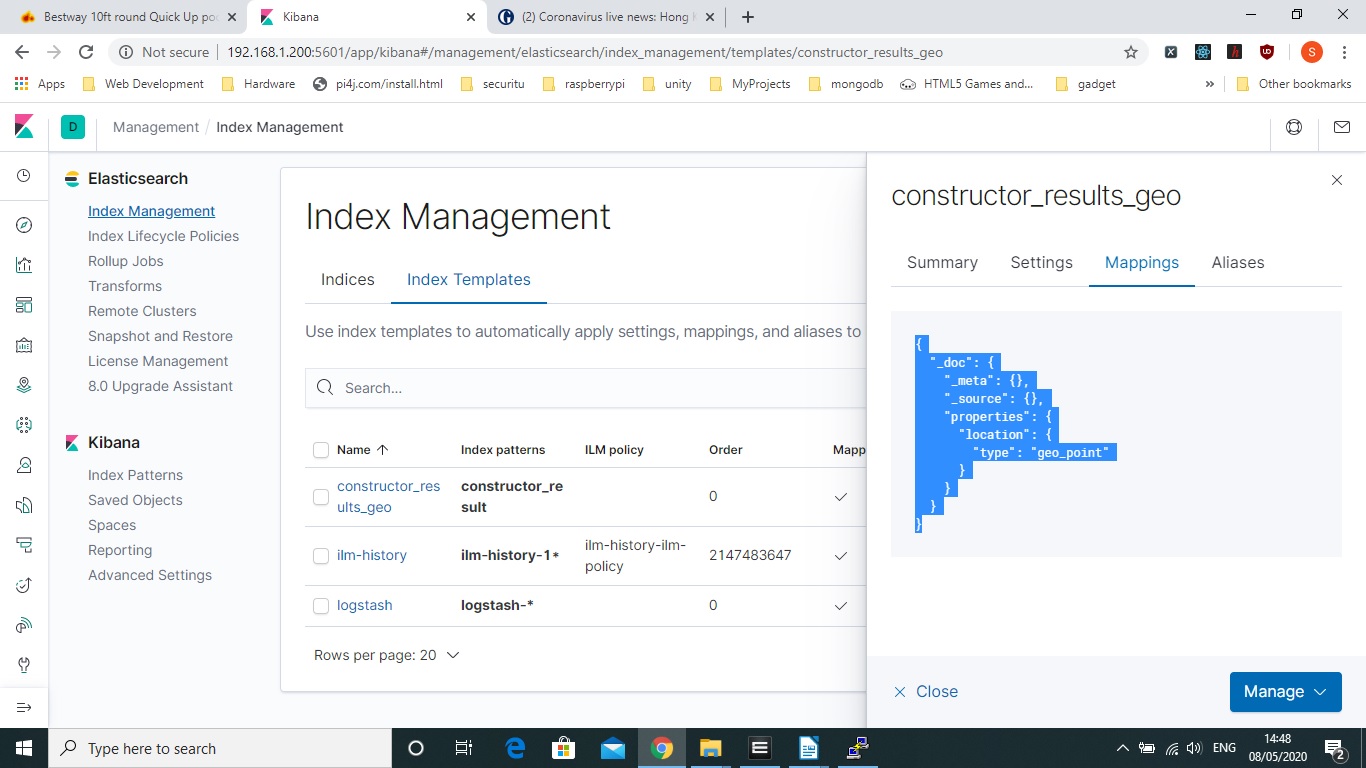
One gotcha that I did notice is that I had to clear and reimport the index to get the Geo Data Type recognised
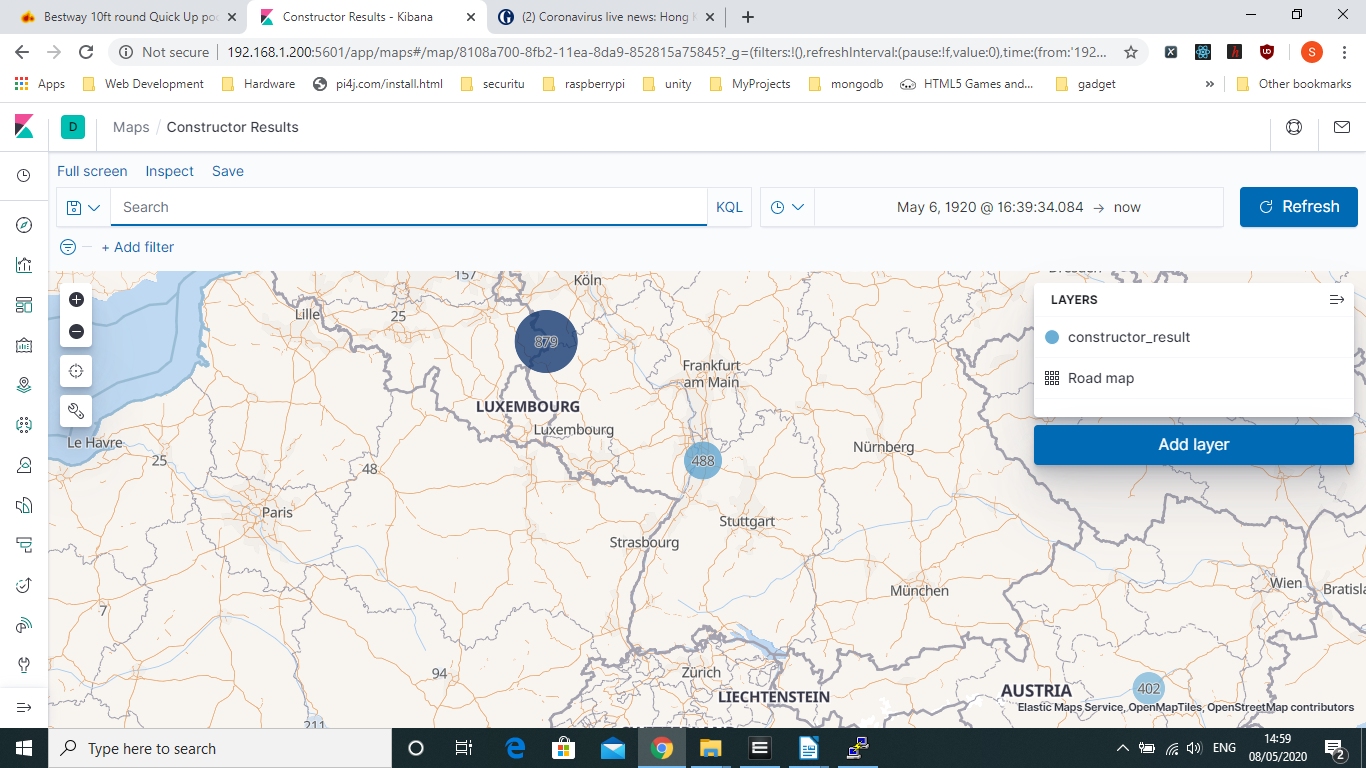
So below you can see one of the map visualisation you get
The Barchart Graph is another easy one you can put together and I ut together a constructor points one that I put together
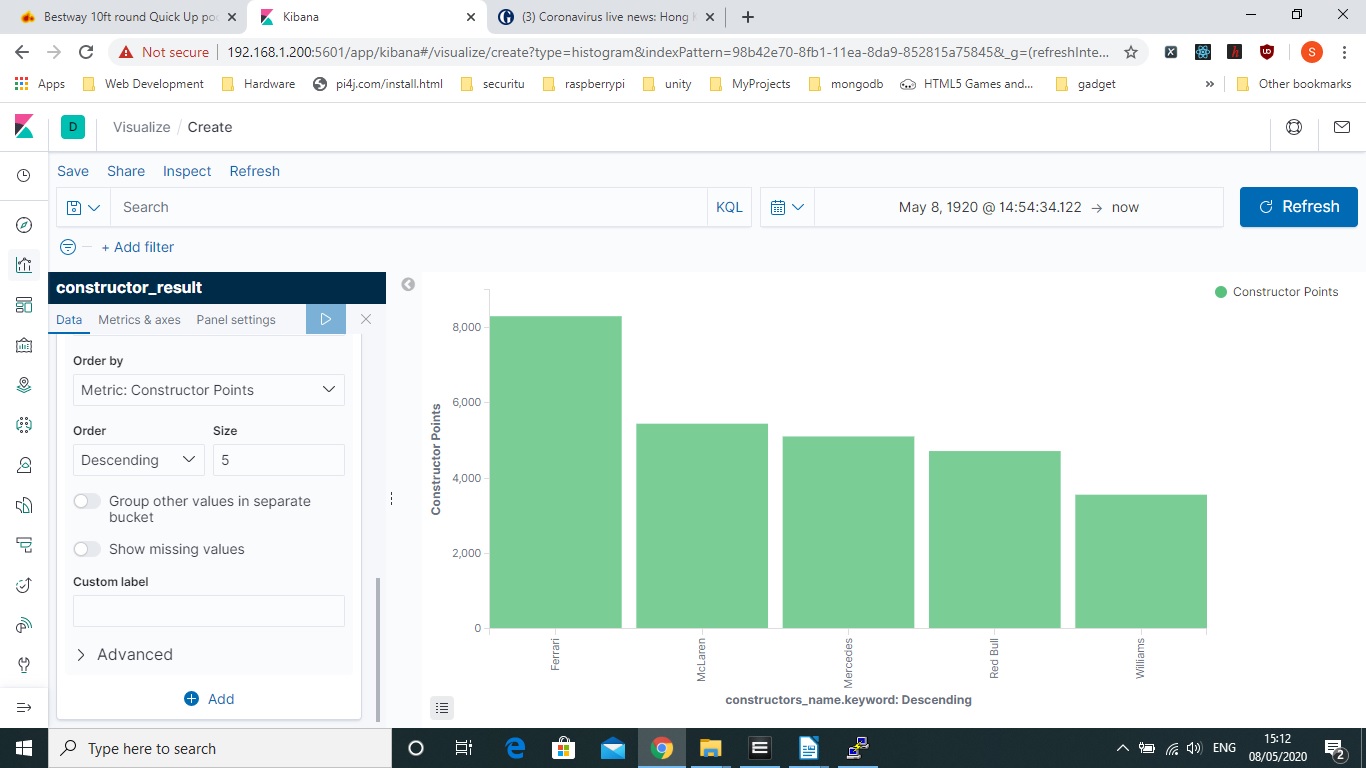
You can play around with the Visualisation. Below you can see the result of the Constructor_Points bar chart. Its all fairly self explanatory with some terminology such as Buckets/Terms which is in this case the constructor name. Also a lot of this tool is for real time data so by default it creates a timestamp that works off the time logstash imports but in a relational database we usually work off our own date which is the race date which us why I have a large date range attached in the below screenshot.
So hopefully when you creating your index pattern you choose the race date on import in which case that was a gotcha as well :)
So that really covers my database developer’s opinion on elasticsearch I am looking forward to try it on some real time data as this is where I think it was really designed to shine as you can use machine learning to model anomalies and such like. There is a lot you can do here with very little programming.

